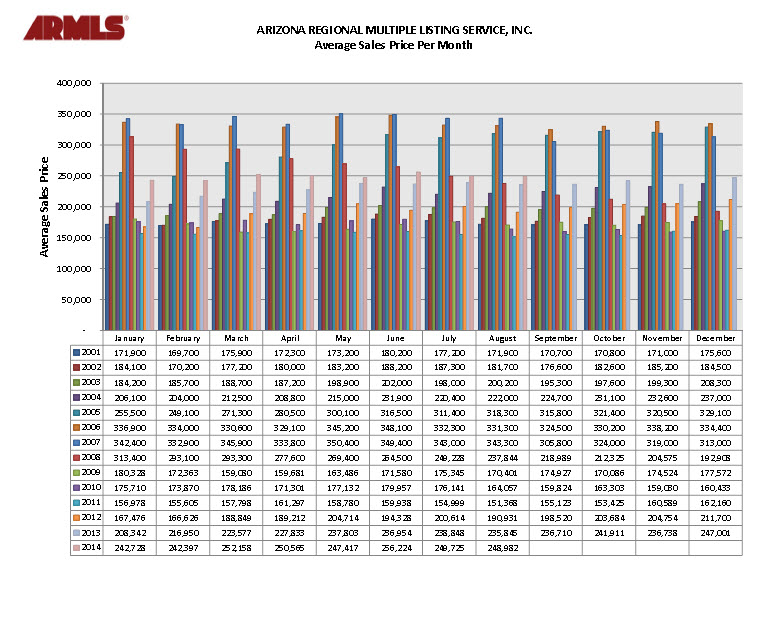
Huge amount of information.. the past 14 years of sales prices by month. I would love to crop and enlarge just one month. Don't need 12 copies of the same information.
I apologize if the picture is too small to read. Here is the gist of it. Let's just look at the column all the way on the left underneath the pretty colored lines.
Let's focus on January 2001-2014 This is the average sales price in the Phoenix Metro area. This includes the palaces in Paradise Valley to the manufactured horse properties in Apache Junction
2001 $171,900
2002 $184,100
2003 $184,200
2004 $206,100
2005 $255,500
2006 $336,900
2007 $342,400
2008 $313,400
2009 $180,328
2010 $175,710
2011 $156,978
2012 $167,476
2013 $206,342
2014 $242,728
Cliff NOTES: From 2004-2006 the average home price increased $130,000. One year later than that in 2007, the market peaked.
From 2007-2009 the average home price DROPPED $162,000.
According to these numbers, the market bottomed out in 2011.
Since the bottom was reached, the average price has rebounded $86,000
Carpe diem-seize the day!